Research Projects
Details-First, Show Context, Overview Last Design Model
Description
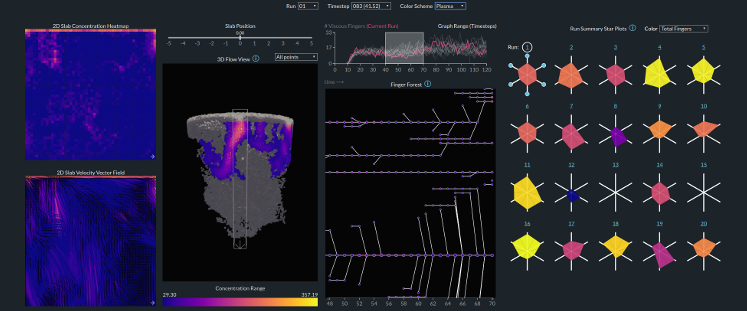
Visualization research often seeks designs that first establish an overview of the data, in accordance to the information seeking mantra. However, in computational fluid dynamics (CFD), as well as in other domains, there are many situations where such a spatial overview is not relevant or practical for users, for example when the experts already have a good mental overview of the data, or when an analysis of a large overall structure may not be related to the specific, information-driven tasks of users. Using scientific workflow theory and, as a vehicle, the problem of viscous finger evolution, we advocate an alternative model that allows domain experts to explore features of interest first, then explore the context around those features, and finally move to a potentially unfamiliar summarization overview.
Astroshelf: Panning and Zooming the Observable Universe
Description
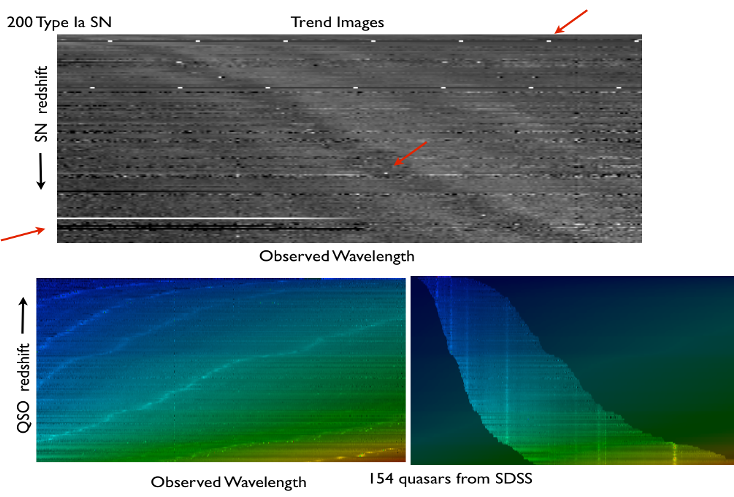
The growing onslaught of astronomical data available presents a great challenge. Astronomy lacks an easy-to-use and scalable way to collect and distribute expert information about objects from datasets of tens of thousands to billions of individual events and objects. Over the next decade, the amount of information available to the typical astronomer will grow by two orders of magnitude both in raw data size and in the number of objects. This project introduces a web-based computing infrastructure to assist the visual integration, mining and interactive navigation of large-scale astronomy observations.
FixingTIM: Identifying Functional Mutations in Protein Families
Description
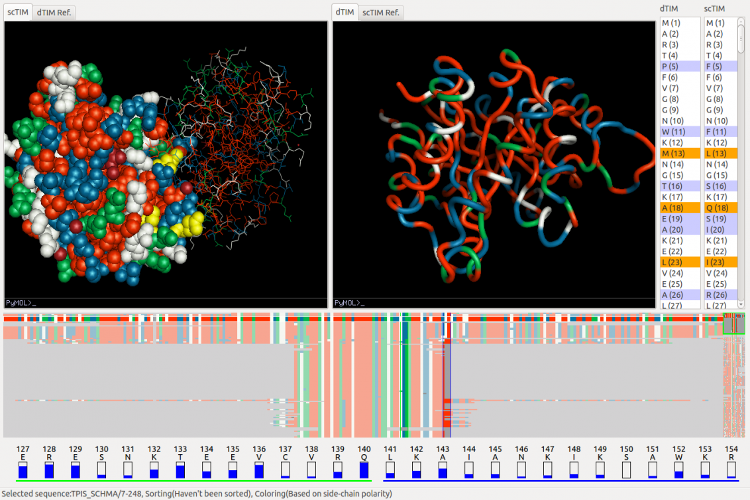
By determining the 3D structure and functionality of proteins, biologists can gain insight into the associated cellular processes, speed up the creation of pharmaceutical products, and develop drugs that are more effective in combating disease. We introduce a novel visualization tool, FixingTIM, to help identify protein mutations across families of structural models, and to help discover the effect of these mutations on protein function
Turbulent Tensors: Visual Analysis for Tensors in Computational Turbulent Combustion
Description
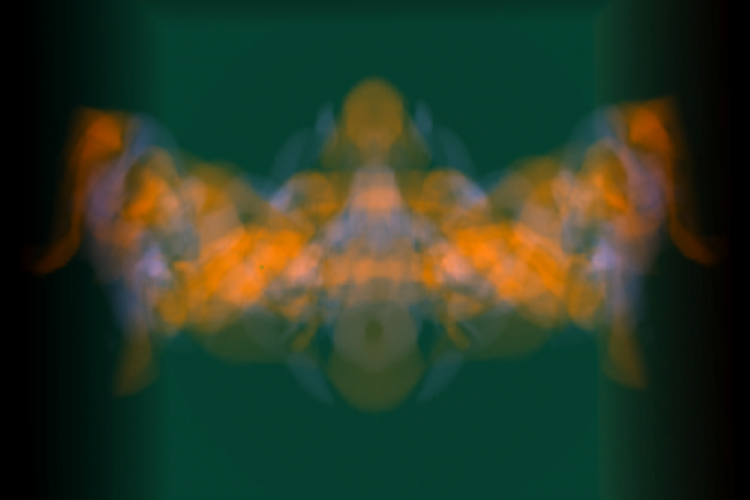
Simulation and modeling of turbulent flow, and of turbulent reacting flowin particular, involves solving for and analyzing time-dependent and spatially dense tensor quantities, such as turbulent stress tensors. Visual exploration of these tensor quantities can effectively steer the computational modeling of combustion systems. The project builds a visual analysis tool to be utilized in debugging, benchmarking, and verification of models and solutions in turbulent combustion.
Interactive Exploration and Tracking of Viscous Fingers in Large-Scale Ensemble Simulations
Description
We present our submission to the SciVis Data Contest 2016. Our submission was a web-based tool for the visual analysis of multi-run fluid flow simulation data. The tool enables the summarization and comparison of ensemble simulation runs.


