Turbulent Tensors: Visual Analysis for Tensors in Computational Turbulent Combustion

Team
M. Monfort, T. Luciani, J. Komperda, B. Ziebart, F. Mashayek, G.E. Marai
Description
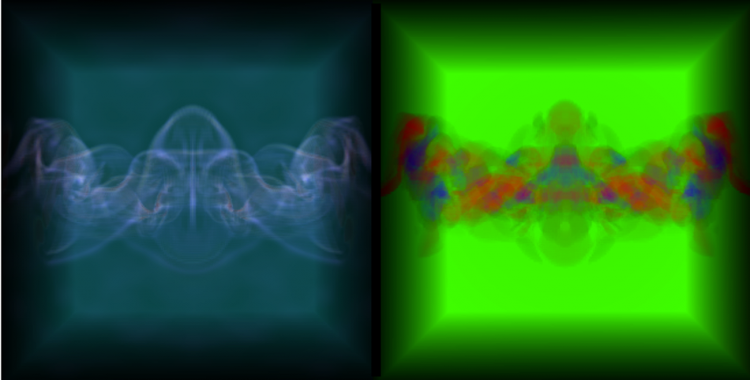
Simulation and modeling of turbulent flow, and of turbulent reacting flow in particular, involves solving for and analyzing time-dependent and spatially dense tensor quantities, such as turbulent stress tensors. The interactive visual exploration of these tensor quantities can effectively steer the computational modeling of combustion systems. In this work we present an integrated, hybrid tensor visualization tool. Volume renderings of the 3D quantities reveal the structure of the dataset, allowing users to identify regions of interest. The regions of interest can then be further explored using the 2D glyph-based representations. Finally, streamlines are also provided to help reveal the structure of the flow through the region of interest. In order to facilitate time-space analysis, we provide a small-multiples interface: users can compare thumbnail, low resolution representations of different time steps and then focus on one time step to view in detail. We demonstrate our application on several turbulent configurations, and show this approach can successfully capture and highlight numerical artifacts in the underlying computational model.


